
Global Temperature
Global temperature is one of the many ways climate scientists measure global climate change. Since the Industrial Revolution, average global temperature has risen by 1 degree Celsius and is projected to rise at least 2 more degrees over the next 100 years. These small changes in the global average temperature may not sound like a lot but have a major effect on the global climate system and can result in more extreme weather patterns, sea level rise and faster rates of melting ice.

The graph above illustrates the change in global surface temperature relative to the 1951-1980 average temperatures. Global surface temperatures in 2010 tied 2005 as the warmest on record (Source: NASA/GISS) The gray error bars represent the uncertainty on measurements. This research is broadly consistent with similar constructions prepared by the Climate Research Unit and the National Atmospheric and Oceanic Administration. Click the graph to view a larger version.
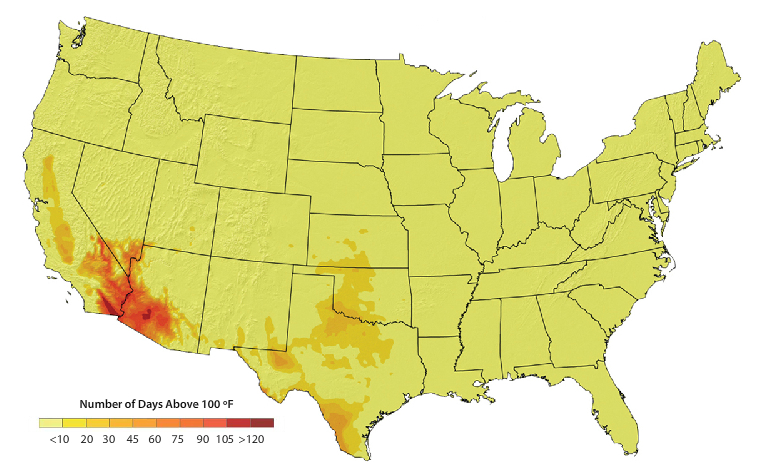
Riverside, CA is already one of the hottest cities in the country, so just imagine our summers if the planet continues to warm! The maps below show projections for the number of days over 100 degrees in the United States. These maps were compiled by the National Oceanic and Atmospheric Administration, and you can read more about the maps and global temperature below.
Recent Past (1961-1979):
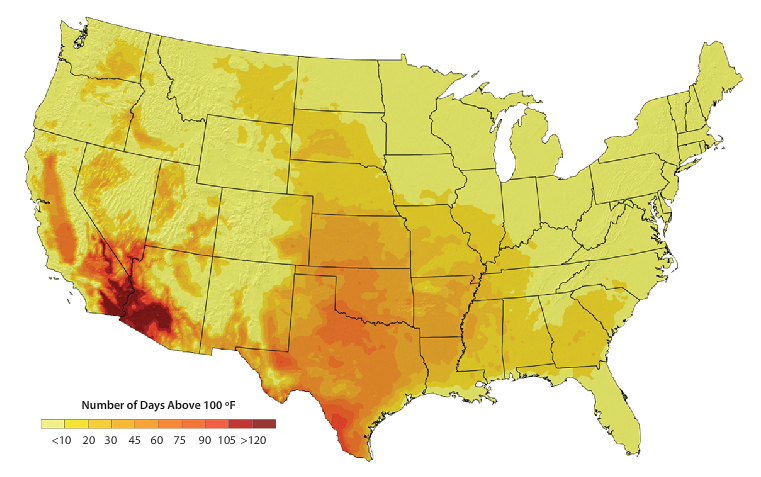
Lower Emissions Scenario (2080-2099):
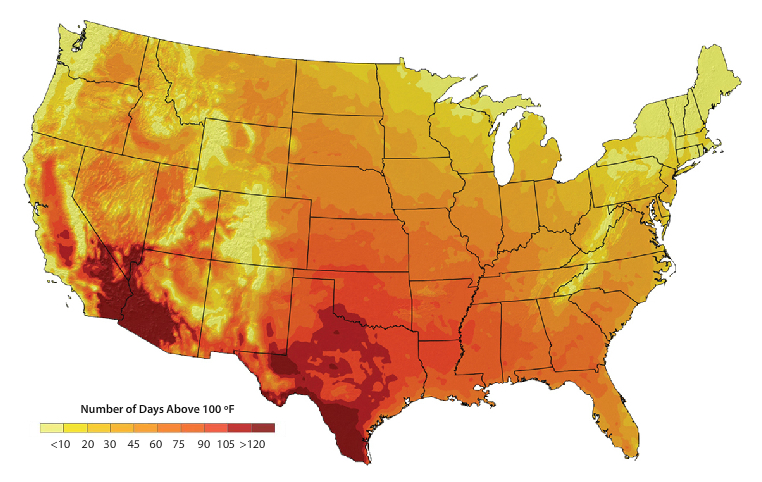
Higher Emissions Scenario (2080-2099):
More than tornadoes, flash floods, or hurricanes, heat is the leading cause of weather-related deaths in the United States. As greenhouse gas emissions and the planet’s temperature continue to rise, models project that heat waves will become more frequent, more severe, and longer-lasting.
The sequence of maps above shows the average number of days on which the temperature across the United States exceeded 100°F between 1961 and 1979, and the number of 100-degree days that might be expected by the end of this century under two different scenarios of future greenhouse gas emissions, one with lower (but still increasing) emissions and one with higher.
In the past, daily high temperatures reached above 100°F for the equivalent of several weeks in parts of California, the southwest, and the Southern Plains. The remainder of the country experienced fewer than ten 100-degree days (and in many states, probably none).
Even in the “greener” lower-emissions scenario, hot days are projected to become more numerous and widespread. In southern California and southwest Arizona, the number of 100-degree days rises to more than 90 per year, and places as far north as Montana and Washington begin to experience 10 to 20 of these hot days each summer.
In the scenario with higher greenhouse gas emissions, parts of Texas that experienced 10 to 20 days per year over 100°F in recent decades are projected to experience more than 100 by the end of the century. Parts of the East Coast as far north as New Jersey could see more than 30 days above 100°F each summer.
The increase in extremely hot days would put an aging U.S. population at the risk of illness and death. Greater demand for air conditioning may also trigger more summer electricity blackouts, and the heat will make it more difficult to keep urban air pollution, including ground-level ozone, at healthy levels.
To address health and safety concerns related to extreme heat, cities can educate residents on how they can protect themselves during heat waves, not just in the future but in the present. Some cities, such as Philadelphia, have implemented a buddy system to check on elderly residents in their homes during these extreme events. When a heat wave health alert is issued, utilities also refrain from shutting off electricity or other services for people behind on their bills, and public cooling places remain open longer.
These maps and many others can be found in the report Global Climate Change Impacts in the United States (2009), a national assessment conducted by experts from 13 U.S. government science agencies, universities, and research institutes.